Average vs. Maximum Drawdown: What the Numbers Really Mean
ELSE Markets Research · September 30, 2026 · 5 min read
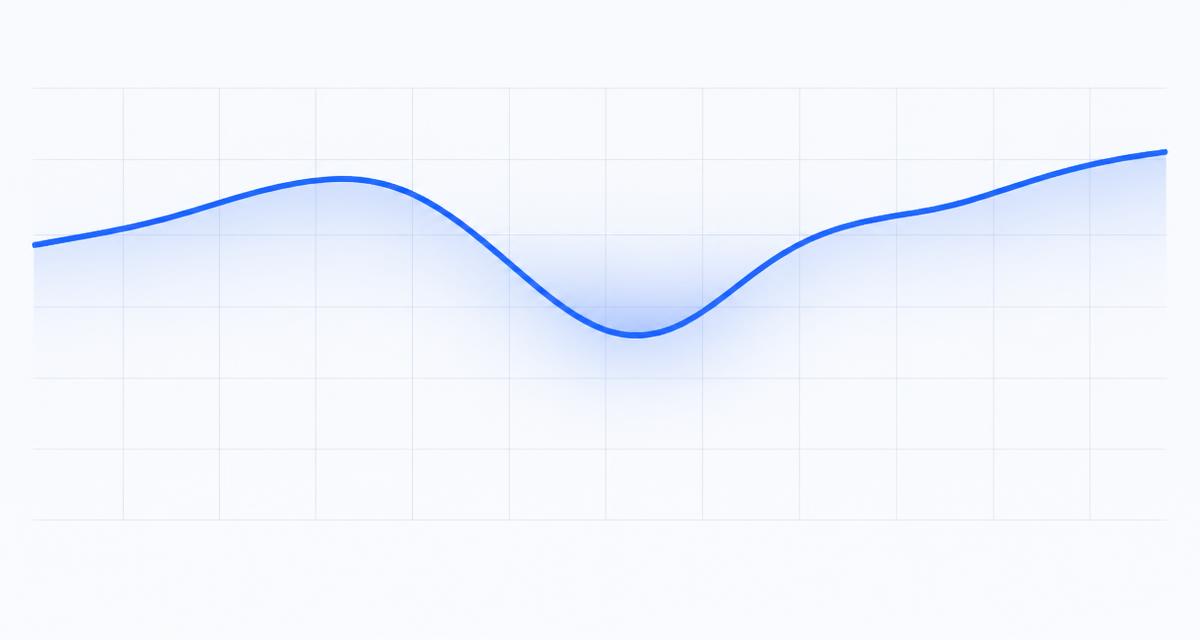
Drawdown measures how far an account falls from a previous high. Average drawdown shows the typical dip; maximum drawdown shows the worst one. They answer different questions, and you need both.
What drawdown is
If an account grows to $10,000 and then dips to $9,500 before recovering, that's a 5% drawdown. Every strategy has them. The question is how deep and how often.
Average drawdown
Average drawdown is the typical size of those dips across the tracked period. It tells you what normal, day-to-day fluctuation tends to look like. A low average suggests the system usually recovers from small dips.
Maximum drawdown
Maximum drawdown is the single largest peak-to-trough drop. It's the number that tests whether you'd stay the course. An average drawdown under 5% does not mean you can't see a larger drop; larger drawdowns can and do occur.
How to use both
Decide in advance how large a drop you could tolerate, size your account accordingly, and ask to see the full history, not only the averages. On an ELSE strategy call we walk through the complete record, including the worst periods.
Average drawdown = typical dip
Maximum drawdown = worst dip so far
Neither predicts the future worst case
See the full tracked record
On a private strategy call we walk through the Gold and EURUSD histories, risk, and deployment. No obligation.